Publication List
- Trabing, B. C., and M. M. Bell, 2021: Observations of Diurnal Variability under the Cirrus Canopy of Typhoon Kong-rey
(2018). Mon. Wea. Rev., 149, 2945-2964, https://doi.org/10.1175/MWR-D-20-0327.1
- Chudler, K. and S. A. Rutledge, 2021: The coupling between convective variability and large-scale flow patterns
observed during PISTON 2018-2019. J. Climate, 34, 7199-7218, https://doi.org/10.1175/JCLI-D-20-0785.1
- Rutledge, S.A., V. Chandrasekar, B. Fuchs, J. George, F. Junyent, B. Dolan, P.C. Kennedy, and K. Drushka, 2019: SEA-POL Goes to Sea. Bull. Amer. Meteor. Soc., 100, 2285–2301, https://doi.org/10.1175/BAMS-D-18-0233.1
- Rutledge, S.A., V. Chandrasekar, B. Fuchs, J. George, F. Junyent, P. Kennedy, and B. Dolan, 2019. Deployment of the
SEA-POL C-band polarimetric radar to SPURS-2. Oceanography 32(2), 50-57, https://doi.org/10.5670/oceanog.2019.212
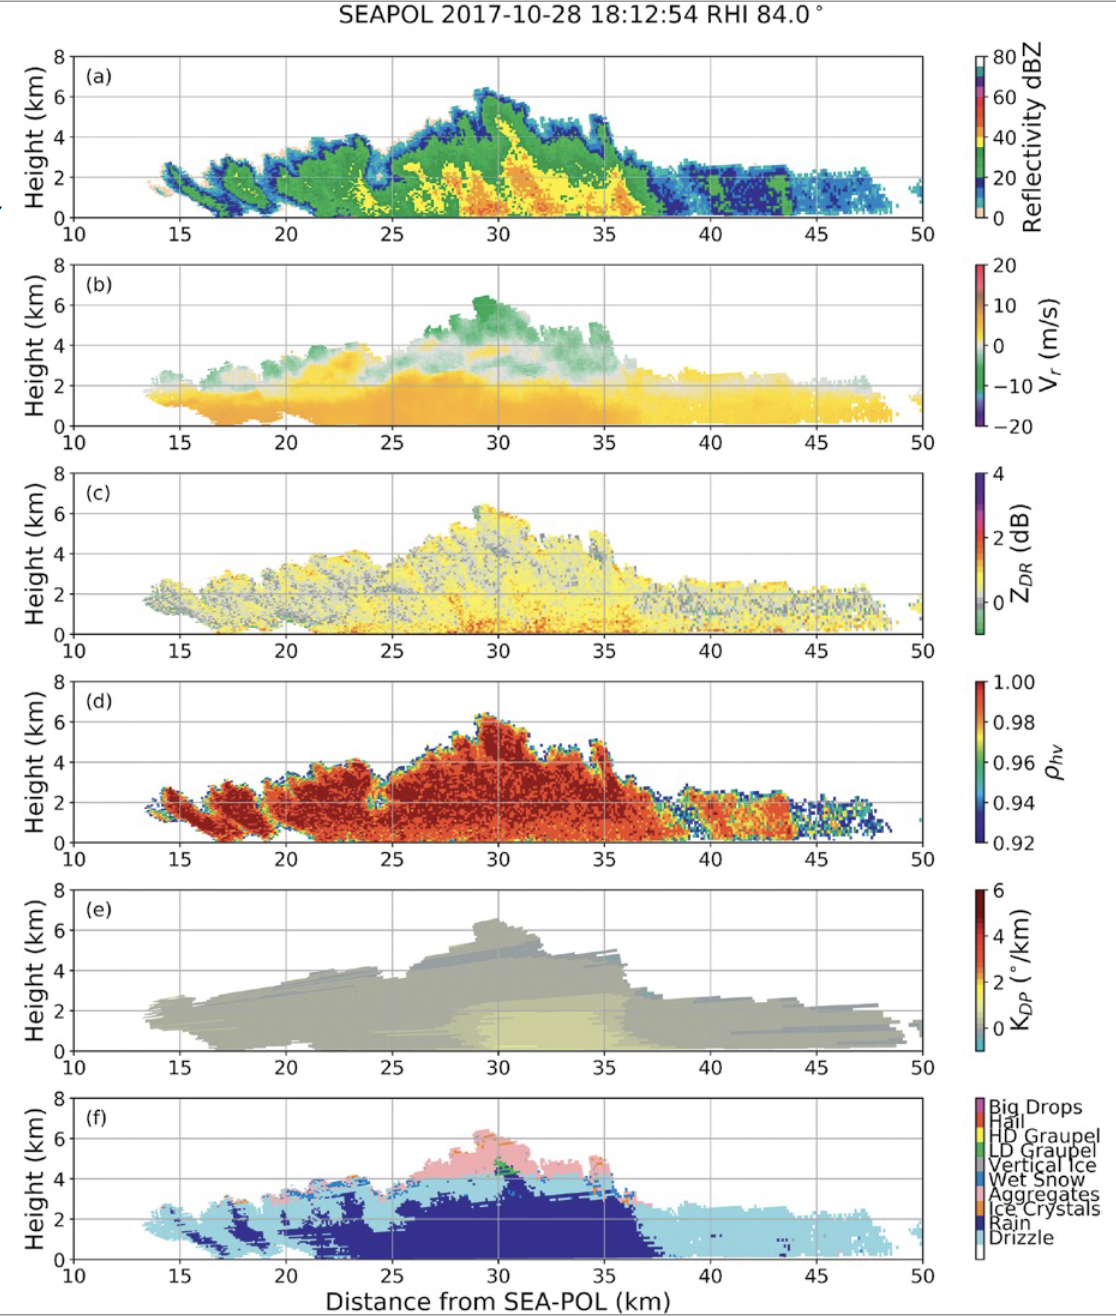
Example data from the SPURS-2 project
Range–height indicator (RHI) plots of (a) reflectivity, (b) Doppler radial velocity corrected for storm motion, (c) differential reflectivity, (d) copolar correlation coefficient, (e) specific differential phase, and (f) hydrometeor classification at 1812:54 UTC 28 Oct 2017 facing east (84° azimuth). From Rutledge et al. (2019)
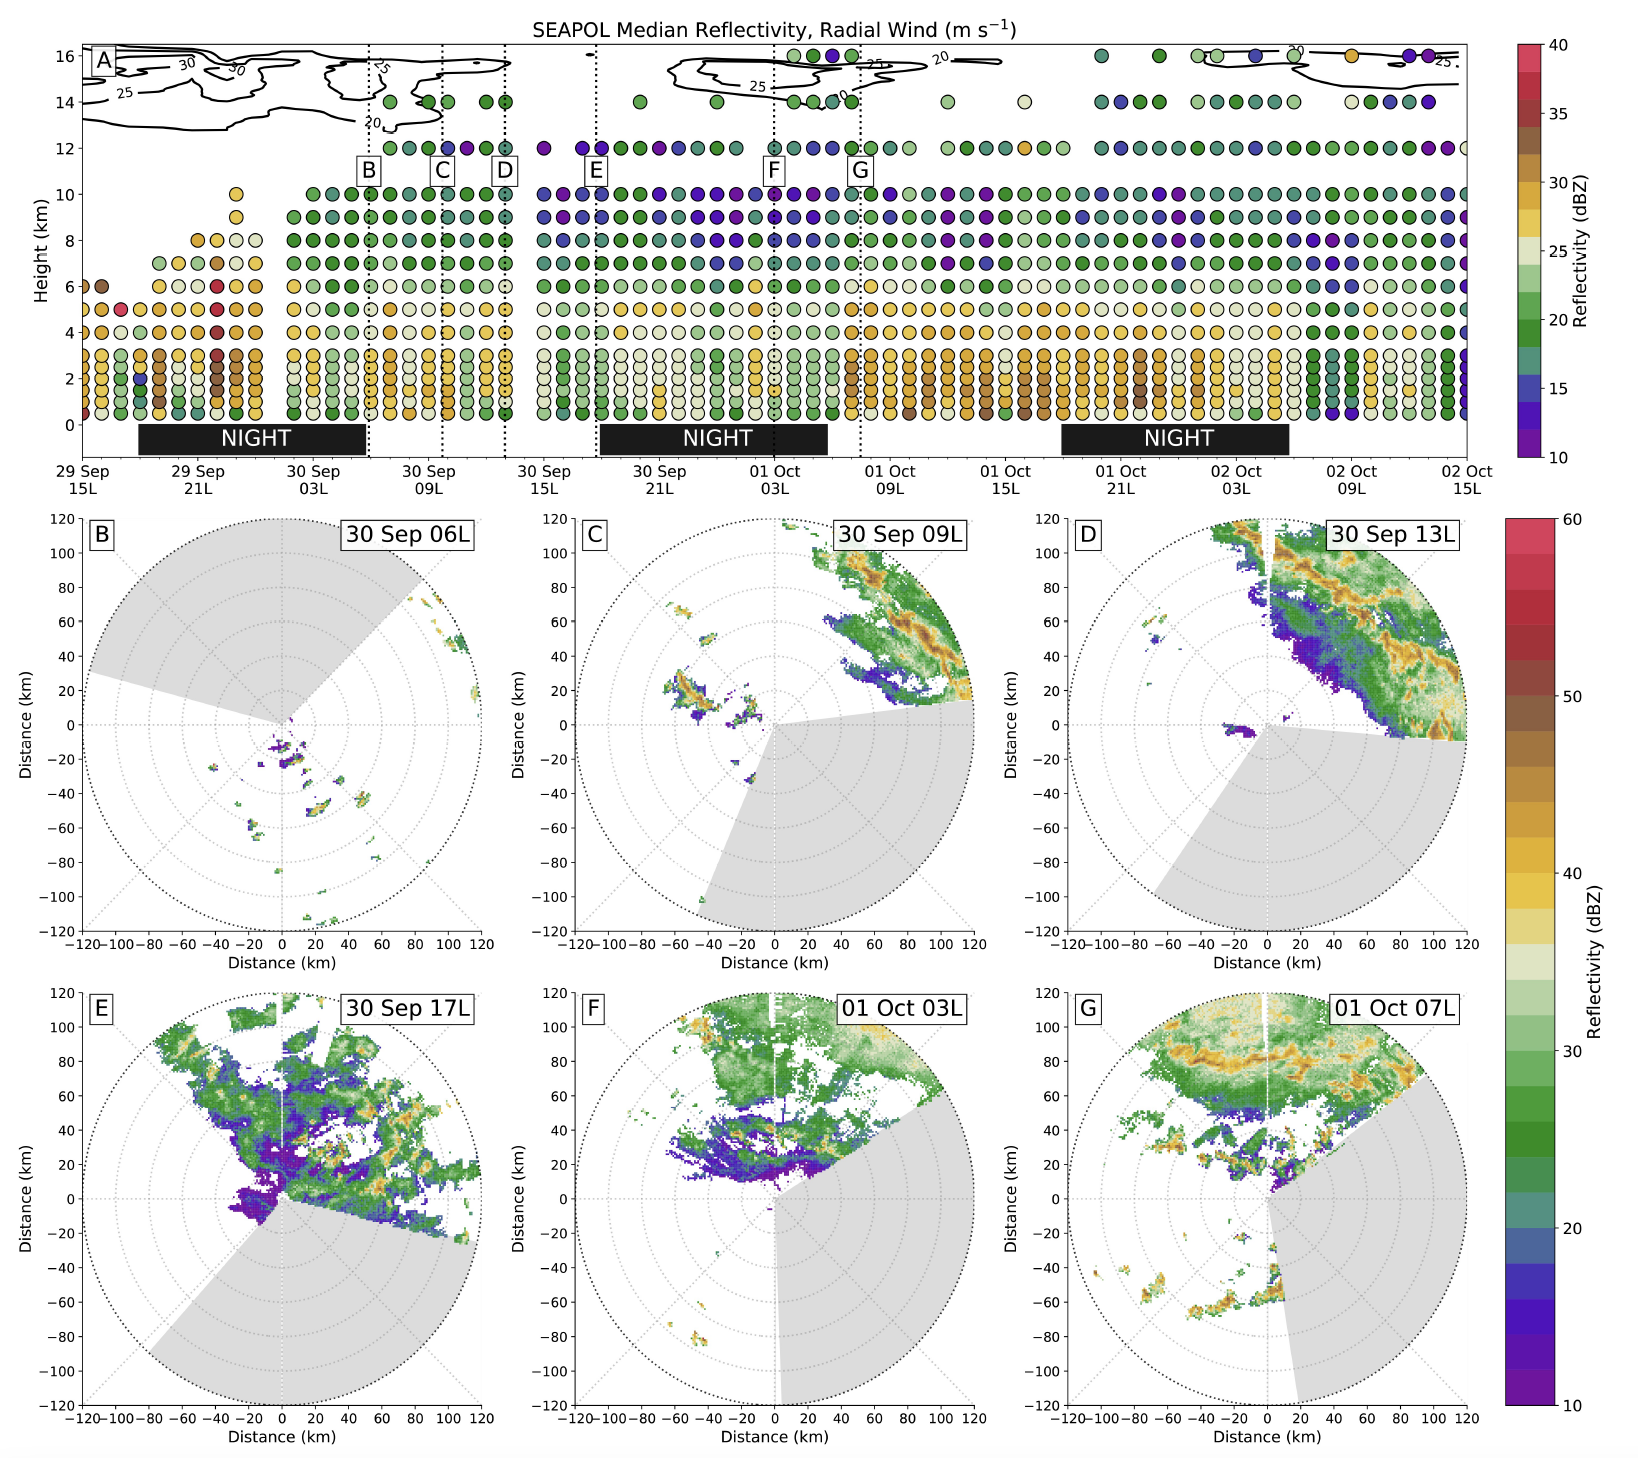
Example data from the PISTON 2018 project
Colored circles in (a) are the evolution of the hourly median
reflectivity profile from gridded SEA-POL data. Contoured in
black are the relative radial winds of Typhoon Kong-Rey
derived from the thermodynamic profiles exceeding 20 m s-1.
(b)–(h) Vertical dotted lines indicate the times of the
corresponding 2-km altitude horizontal cross sections. The gray
shaded region is where SEA-POL was not transmitting and
collecting observations, which changes with ship heading.
Times where no solar radiation is affecting the cloud
distribution sare denoted for reference. Both color bars use
increments of 2 dBZ; however, the evolution of the median
reflectivity and the cross sections use slightly different color
bars because of the differences in the range of values. From
Trabing and Bell (2021)